Friday, February 19, 2016

Blog Week 6

Blogsheet week 6
Operational Amplifiers
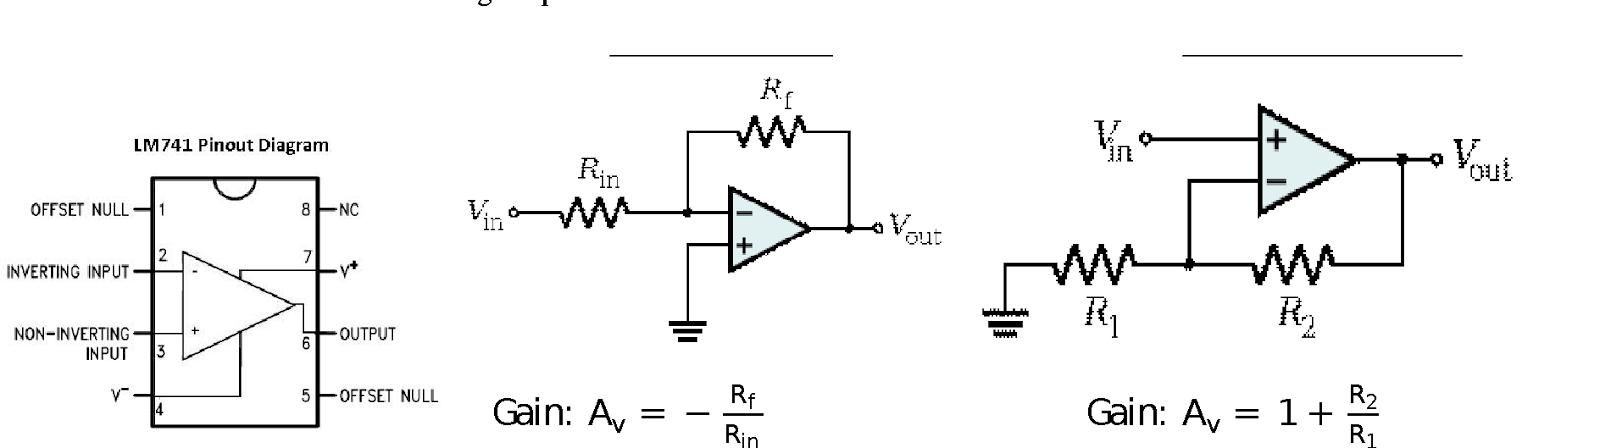
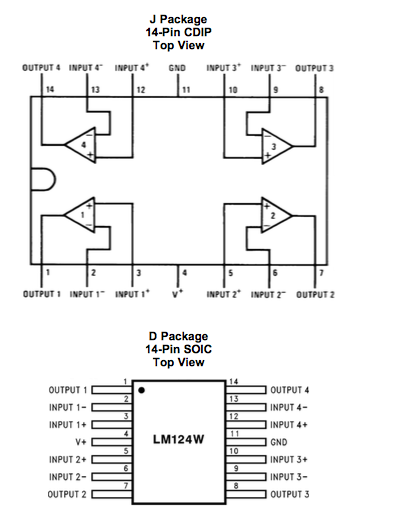
Explanations of the pin numbers are below:
1: DO NOT USE
8: DO NOT USE
2: Negative input
7: +10V
3: Positive input
6: output
4: -10 V
5: DO NOT USE
1. You will use the OPAMP in “open-loop” configuration in this part, where input signals will be applied directly to the pins 2 and 3.


  1. Apply 0 V to the inverting input. Sweep the non-inverting input (Vin) from -10 V to 10 V with 1 V steps. Take more steps around 0 V (both positive and negative). Create a table for Vin and Vout. Plot the data (Vout vs Vin). Discuss your results. What would be the ideal plot? Table One
    Vin
    Vout
    -10 V
    -3.719 V
    -7 V
    -3.72 V
    -5 V
    -3.72 V
    -3 V
    -3.72 V
    -1 V
    -3.72 V
    -0.5 V
    -3.72 V
    0 V
    -3.72 V
    0.5 V
    4.44 V
    1 V
    4.44 V
    3V
    4.44 V
    5 V
    4.44 V
    7 V
    4.44 V
    10 V
    4.44 V
    Table-1

    Graph-1

  1. Apply 0 V to the non-inverting input. Sweep the inverting input (Vin) from -10 V to 10 V with 1 V steps. Take more steps around 0 V (both positive and negative). Create a table for Vin and Vout. Plot the data (Vout vs Vin). Discuss your results. What would be the ideal plot? Table Two
    Vin
    Vout
    -10 V
    4.44 V
    -7 V
    4.44 V
    -5 V
    4.44 V
    -3 V
    4.44 V
    -1 V
    4.44 V
    -0.5 V
    4.44 V
    0 V
    N/A
    0.5 V
    -3.7 V
    1 V
    -3.7 V
    3V
    -3.7 V
    5 V
    -3.7 V
    7 V
    -3.7 V
    10 V
    -3.7 V
    Table-2
    Graph-2
  1. Create a non-inverting amplifier. (R2 = 2 kΩ, R1 = 1 kΩ). Sweep Vin from -10 V to 10 V with 1 V steps. Create a table for Vin and Vout. Plot the measured and calculated data together. Table Three
    Vin
    Vout
    Vin
    Vout
    -10 V
    -3.61 V
    0.5 V
    1.48 V
    -9 V
    -3.61 V
    1 V
    2.966 V
    -8 V
    -3.61 V
    2 V
    4.2 V
    -7 V
    -3.61 V
    3 V
    4.2 V
    -6 V
    -3.61 V
    4 V
    4.2 V
    -5 V
    -3.61 V
    5 V
    4.2 V
    -4 V
    -3.61 V
    6 V
    4.2 V
    -3 V
    -3.61 V
    7 V
    4.2 V
    -2 V
    -3.606 V
    8 V
    4.2 V
    -1 V
    -2.96 V
    9 V
    4.2 V
    -0.5 V
    -1.45 V
    10 V
    4.2 V
    Table-3

    Graph-3


  1. Create an inverting amplifier. (Rf = 2 kΩ, Rin = 1 kΩ). Sweep Vin from -10 V to 10 V with 1 V steps. Create a table for Vin and Vout. Plot the measured and calculated data together. Table Four
    Vin Vout Vin Vout
    -5 V
    4.15 V
    0.5 V
    -0.769 V
    -4 V
    4.14 V
    1 V
    -1.85 V
    -3 V
    4.16 V
    2 V
    -3.56 V
    -2 V
    3.94 V
    3 V
    -3.54 V
    -1 V
    1.52 V
    4 V
    -3.56 V
    -0.5 V
    1.13 V
    5 V
    -3.56 V
    Table-4
    Graph-4


  1. Explain how an OPAMP works. How come is the gain of the OPAMP in the open loop configuration too high but inverting/non-inverting amplifier configurations provide such a small gain? An op amp works by taking two input signals and producing an output signal. Ideally, for the op amp, both inputs would be the same, however, as the inputs differ, the amplifier tends to push the output towards infinity. As a result with no resistances or feedback, the gain can seem to change instantaneously. But the Op Amp will still be restricted by laws of conservation.
EGR 393 Temperature Controlled LED System

Tips:

1. If something is not working, check your connection first.
2. Check the pins carefully, LM35 is VERY easy to be burned if you connect the wrong pins.
3. Read the datasheet carefully.
4. Before starting to connect the circuit, try to sketch it on a paper first, make sure everything is clear.

Components:

1. TMP36 Temperature Sensor 2. Lm324 Operational Amplifier 3. OMRON G8QN Relay 4. LED

Procedure:
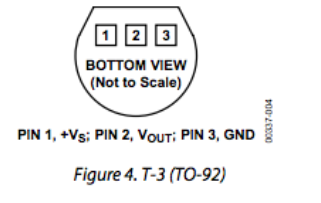

Macintosh HD:Users:Katherine:Desktop:Screen Shot 2015-12-07 at 9.09.58 PM.png
TMP36 Temperature Sensor: Pin layout – look up characteristics to calculate temperature from datasheet (under Bb/Week6).

Temperature Sensor: Put TMP36 temp sensor on breadboard.
  • Connect the +VS to 5 volts and GND to ground.
  • Using a voltage meter, measure the output voltage from the VOUT. Now put your finger (or cover the sensor with your palm) on the TMP36 temperature sensor for a while, observing how the output voltage changes. Check Fig. 6 in the data sheet (EXPLAIN). When we measured the voltage of the circuit at room temperature, we saw an output voltage of 0.71 V. When we heated it by hand, however, we saw an output voltage of 0.78 V. That's an increase of 0.07 volts just by covering it with one's hand.

Relay (Manual under Bb/Week6)
Macintosh HD:Users:Katherine:Desktop:Screen Shot 2015-12-07 at 9.33.00 PM.png
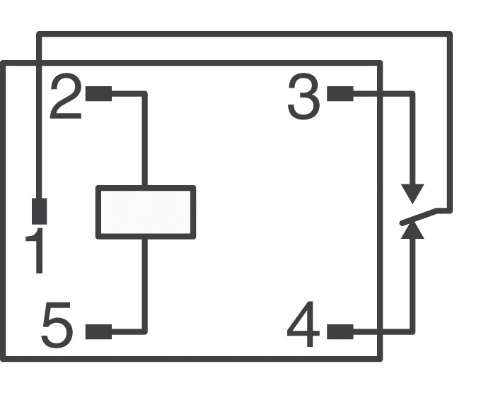
Pin 1 – Input voltage (amount of voltage sent to pins 3 or 4)
Pin 2 – Power supply
Pin 3 – Vout = Vin when Vin > Vthreshold
Pin 4 – Vout = Vin when Vin < Vthreshold
Pin 5 - GND
schematic view is the bottom view!
    1. Connect your DC power supply to pin 2 and ground pin 5. Set your power supply to 0V. Switch your multimeter to measure the resistance mode; use your multimeter to measure the resistance between pin 4 and pin 1. Do the same measurement between pin 3 and pin 1. Explain your findings (EXPLAIN). Between pins 1 and 4 we saw a resistance of 1 ohm. We saw no available measurement between pins 3 and 1. This makes sense. If the relay is switched to one position, the other should not be conducting between the pins and thus would not give us a resistance.
    2. Now sweep your DC power supply from 0V to 8V and back to 0V. What do you observe at the multimeter (resistance measurements similar to #1)? Did you hear a clicking sound? How many times? What is the “threshold voltage values” that cause the “switching?” (EXPLAIN with a VIDEO).


Relay Click
    1. How does the relay work? Apply a separate DC voltage of 5 V to pin 1. Check the voltage value of pin 3 and pin 4 (each with respect to ground) while switching the relay (EXPLAIN with a VIDEO).
Pin 3


Pin 4


LED + Relay
    1. Connect positive end of the LED diode to the pin 3 of the relay and negative end to a 100 ohm resistor. Ground the other end of the resistor. Negative end of the diode will be the shorter wire.
    2. Apply 3 V to pin 1
    3. Turn LED on/off by switching the relay. Explain your results in the video. Draw the circuit schematic (VIDEO)
LED Light Up


Operational Amplifier (data sheet under Bb/week 6)
    1. Connect the power supplies to the op-amp (+10V and -10V). Show the operation of LM 124 operational amplifier in DC mode with a non-inverting amplifier configuration. Choose any opamp in the IC. Method: Use several R1 and R2 configurations and change your input voltage and record your output voltage. (EXPLAIN with a TABLE)
      R1
      R2
      Vin1
      Vout1
      Vin2
      Vout2
      2KΩ
      1KΩ
      1.2 V
      1.9 V
      6.5 V
      8.5 V
      120Ω
      1KΩ
      0.76 V
      7.3 V
      1.49 V
      8.36 V
      We also experimented with a constant input of about 0.8V and a fair amount of different resistors in order to see what differences in voltage we might receive. We kept R2 as a constant 1KΩ to ensure that we would better understand the changes we made.  Our goal was to find about 5.6 V output using around 0.8 V input.  We used the following equation to make our estimations.
      This yielded a experimental R1 of about 160 Ω.
    2. Use your temperature sensor as your input. Do you think you can generate enough voltage to trigger the relay? (EXPLAIN) Not by itself. Even if we got it quite hot, we probably couldn't generate the right amount of voltage. The way to solve this is to use both the temperature sensor and the op amp. We did this using different values of resistance for R1. Our calculation in the previous task was a step in the right direction, however, we found that our output voltage while the temperature sensor was at room temperature was still too high. In order to solve this, we made R2 slightly bigger. At 150 Ω we were able to make it work and at 180 Ω we were able to make the relay trigger comfortably. 
    3. Design a system where LED light turns on when you heat up the temperature sensor. (CIRCUIT schematic and explanation in a VIDEO)  


Here's an image of one potential circuit that could be used to light the LED.  We didn't build this exact circuit, however, the same (but more complex) idea can be seen in the next video.  We set the temperature sensor to  supply an input voltage to the OP amp which then amplified the voltage high enough to switch the relay which connected the LED through a 100 Ohm resistor to ground.
    1. BONUS! Show the operation of the entire circuit. (VIDEO)
Macintosh HD:Users:Katherine:Desktop:Screen Shot 2015-12-08 at 1.24.56 PM.png


Friday, February 12, 2016

Blog week 5

Blog sheet week 5
1.       Functional check: Oscilloscope manual page 5. Perform the functional check (photo).


2.       Perform manual probe compensation (Oscilloscope manual page 8) (Photo of overcompensation and proper compensation).
Overcompensation

Undercompensation


Proper Compensation


3.       What does probe attenuation (1x vs 10x) do (Oscilloscope manual page 9)?

The attenuation factor affects the vertical scale of the signal.  When the probe is set to the 1X setting the bandwidth is limited to only 7Mhz. By switching to the 10X setting it is possible to get the full bandwidth of the probe.

4.       How do vertical and horizontal controls work? Why would you need it (Oscilloscope manual pages 34-35)?

For the horizontal position on the oscilloscope it establishes the time between the trigger and the screen center. For the vertical controls we are able to scale the waveforms for volts/div on channels 1,2,3 and 4. Also the vertical position of the waveform can be adjusted with the controls.


5.       Generate a 1 kHz, 1 Vpp around a DC 2 V from the function generator (use the output connector). DO NOT USE oscilloscope probes for the function generator. There is a separate BNC cable for the function generator.
a.       Connect this to the oscilloscope and verify the input signal using the horizontal and vertical readings (photo).


b.      Figure out how to measure the signal properties using menu buttons on the scope.

The menu buttons allow us to see the frequency, period, voltages and more.


6.       Connect function generator and oscilloscope probes switched (red to black, black to red). What
happens? Why?

No signal displays on the oscilloscope.  The signal is no longer travelling through the scope, but rather, is being passed to ground. 


7.       After calibrating the second probe, implement the voltage divider circuit below. Measure the following voltages using the Oscilloscope and comment on your results:
a.       Va and Vb at the same time (Photo)
b.      Voltage across R4.


The resistance across R4 was measured at 240mv-119mV giving a value of 121mV.


8.       For the same circuit above, measure Va and Vb using the handheld DMM both in AC and DC mode. What are your findings? Explain.


AC
Va= .092mV
Vb=0.182mV

DC
Va=17.8 mV
Vb=34.2mV

The measurements from the circuit for Vb are about double the measurement of Va. Since the resistors are the same they will use the same amount of voltage. 


9.
  
     For the circuit below
a.       Calculate R so given voltage values are satisfied. Explain your work (video)
Hand Calculation 

Converting the 5V rms to peak voltage it is possible to calculate the resistance so the voltage values are satisfied at 6.07k. 


b.      Construct the circuit and measure the values with the DMM and oscilloscope (video). Hint: 1kΩ cannot be probed directly by the scope. But R6 and R7 are in series and it does not matter which one is connected to the function generator.

Circuit DMM reading


                 Oscilloscope Reading


10.   Operational amplifier basics: Construct the following circuits using the pin diagram of the opamp. The half circle on top of the pin diagram corresponds to the notch on the integrated circuit (IC). Explanations of the pin numbers are below:
1: DO NOT USE
8: DO NOT USE
2: Negative input
7: +10V
3: Positive input
6: output
4: -10 V
5: DO NOT USE
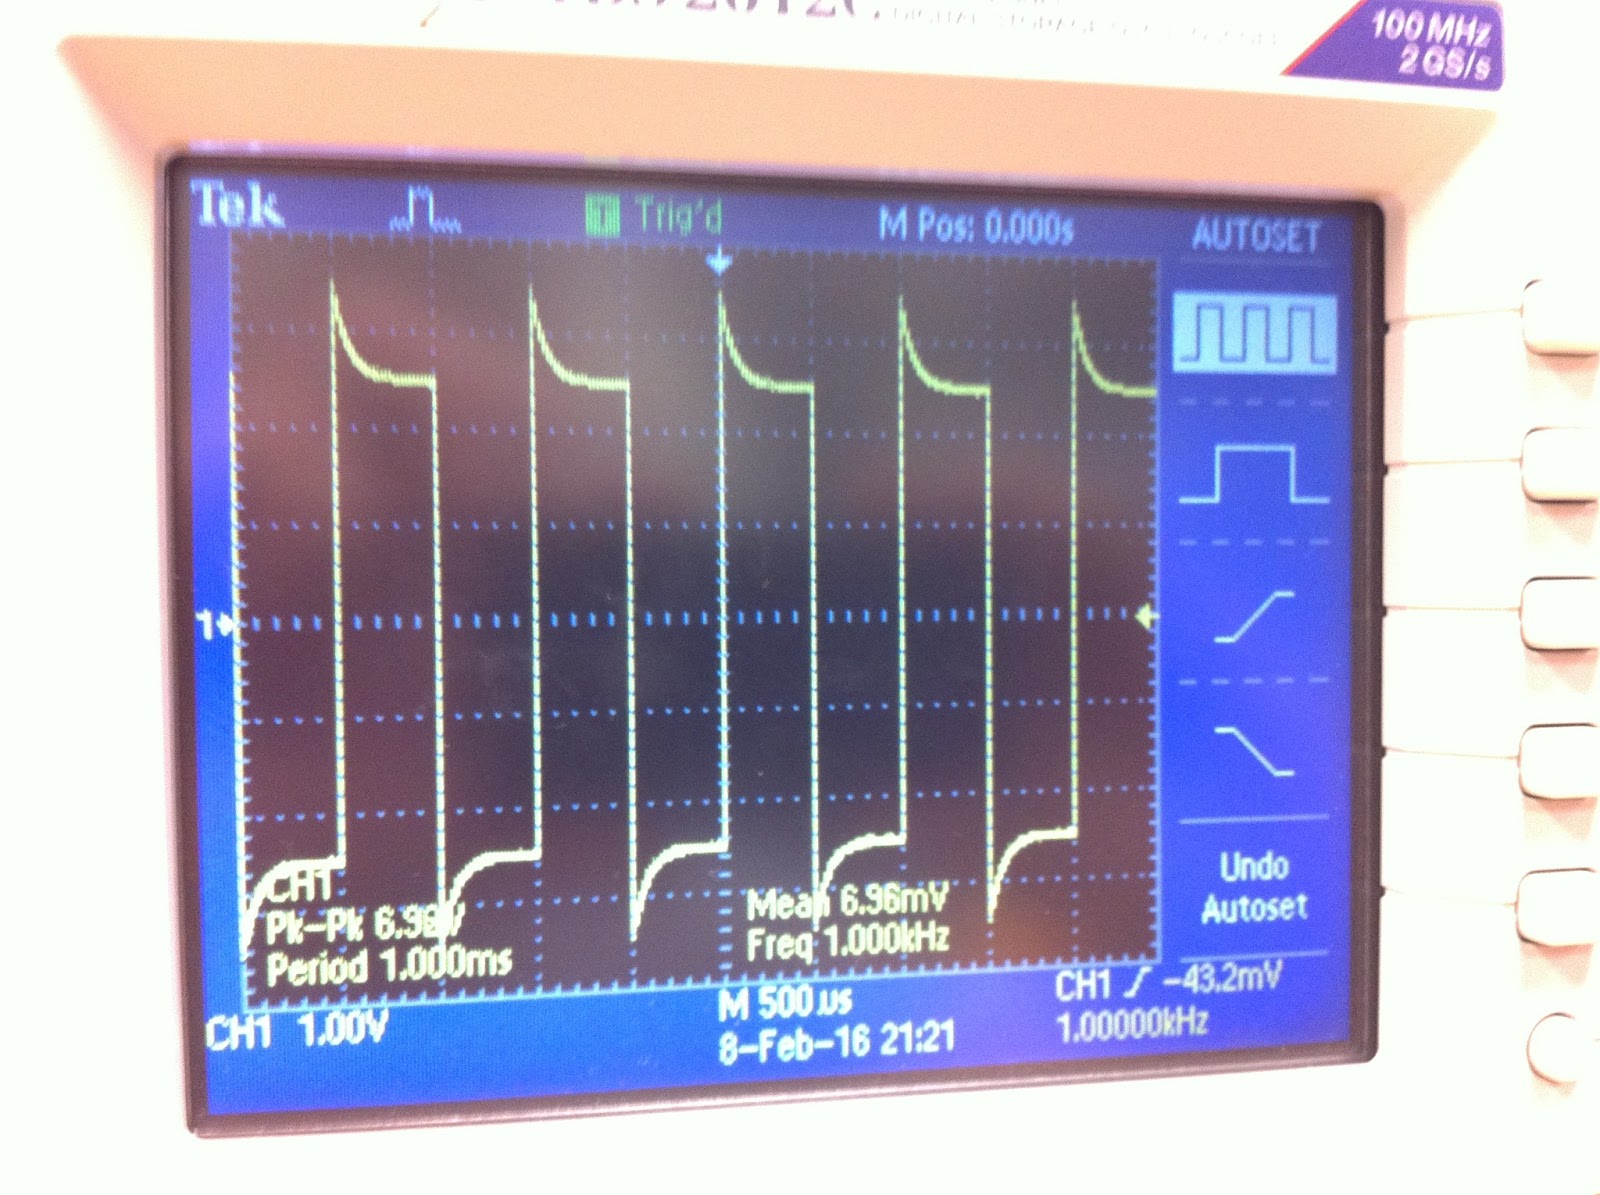
a.       Inverting amplifier: Rin = 1kΩ, Rf = 5kΩ (do not forget -10 V and +10 V). Apply 1 Vpp @ 1kHz. Observe input and output at the same time. What happens if you slowly increase the input voltage up to 5 V? Explain your findings. (Video)


Inverting Amplifier 
Inverting Amplifier Waveform

Slowly increasing the voltage will saturate the circuit and the waveform will begin to square off. 


b.      Non-inverting amplifier: R1 = 1kΩ, R2 = 5kΩ (do not forget -10 V and +10 V). Apply 1 Vpp @ 1kHz. Observe input and output at the same time. What happens if you slowly increase the input voltage up to 5 V? Explain your findings. (Video)
Non Inverting Amplifier 


        Non Inverting Amplifier Waveform

Slowly increasing the voltage will saturate the circuit and the waveform will begin to square off. 

Friday, February 5, 2016

Blog Week 4

In this week's activities, we will be using transistors to breadboard simple circuits.

1.       (Table and graph) Use the transistor by itself. The goal is to create the graph for IC (y axis) versus VBE (x axis). Connect base and collector. Use 10K potentiometer to generate the voltage. Use 5 V but DO NOT EXCEED 1 V for VBE. Make sure you have the required voltage value set before applying it to the base. Transistor might get really hot. Do not TOUCH THE TRANSISTOR! Make sure to get enough data points to graph. (Suggestion: measure for VBE = 0V, 0.5V, and 1V and fill the gaps if necessary by taking extra measurements). The circuit should look like below:

Circuit 1


          Table 1                                           Graph 1


2.       (Table and graph) Create the graph for IC (y axis) versus VCE (x axis). Vary VCE from 0 V to 5 V. Do this measurement for 3 different VBE values: 0V, 0.7V, and 0.8V. The circuit should look like below:

Circuit 2


                  Table 2                                                             Graph 2
  
1.       Apply 2 V to the DC motor and measure the current. Repeat this by increasing the load on the DC motor. Slightly pinching the shaft would do the trick.

     By increasing the load by pinching to the shaft of the DC motor, we were able to see a large increase of current to the motor. With the increased load the current was measured at 92.5 mA. Without the increased load on the DC motor the current measured to be 33.48 mA.


3.       (Table) Apply the following bias voltages and fill out the table. How is IC and IB related? Does your data support your theory?
VBE
VCE
IC
IB
0.7 V
2 V
40µA
7.28mA
0.75 V
2 V
40µA
48.8mA
0.8 V
2 V
40µA
66.8mA
Table 3

4.       (Table) Explain photocell outputs with different light settings. Create a table for the light conditions and photocell resistance.
                           Photo-sensor Light
                                  Resistance
                                  Blocked                       
                                 9.45k Ohms
                           Partially Blocked                        
                                 5.56k Ohms
                               Room Light
                                 1.17k Ohms
                                Flash Light
                                 .345k Ohms
Table 4


    (Table) Apply voltage (0 to 5 V with 1 V steps) to DC motor directly and measure the current using the DMM.
                                                                  
                  Voltage 
                     Current
                        0
                       .38   mA
                        1
                       26.9 mA
                        2
                       33.2 mA
                        3            
                       39.1 mA
                        4
                       44.6 mA
                        5
                       49.8 mA 
                                               Table 5

     
6.       Apply 2 V to the DC motor and measure the current. Repeat this by increasing the load on the DC motor. Slightly pinching the shaft would do the trick. 

                                                                   
                                                                               Table 6


7.       (Video) Create the circuit below (same circuit from week 1). Explain the operation in detail.

Circuit 3


8.       Explain R4’s role by changing its value to a smaller and bigger resistors and observing the voltage and the current at the collector of the transistor.

      R4’s role for the circuit is if the resistance for the resistor in the circuit increases the motor gets much less power. Lower the resistance of R4 and the motor will spin faster as it has more voltage going through it.


9.       (Video) Create your own Rube Goldberg setup.


If video does not show up.
https://www.youtube.com/watch?v=u_NePad6v9M&feature=youtu.be