Monday, March 14, 2016

Week 9

IMPORTANT NOTE:
Starting this week, the course format will slightly change:
  • Blogsheet information entry to the blog as group (blogG) will be reduced. You will only require to put short sentences as comments. The blogsheet will still be due Monday. The points for this part will be reduced to 10 points from 20 points.
  • Post-quiz will only be 10 points and include experiment related questions. Blog related questions will be removed from Friday’s quiz. However;
  • Blog related post-quiz questions (10 points) will be individually submitted (blogI) along with detailed blogsheet information submission (10 points) that are typed in red text in the blogsheet. This assignment will be due Wednesday the following week.
  • Commenting and responding to comments will be due the following Wednesday.


Blogsheet week 9
  1. Measure the resistance of the speaker. Compare this value with the value you would find online.
resistance- 8.1 Ohms Online- Around 8 Ohms


  1. Build the following circuit using a function generator setting the amplitude to 5V (0V offset). What happens when you change the frequency? (video)
C:\Users\kolar1km.CENTRAL\Desktop\AC1.PNG
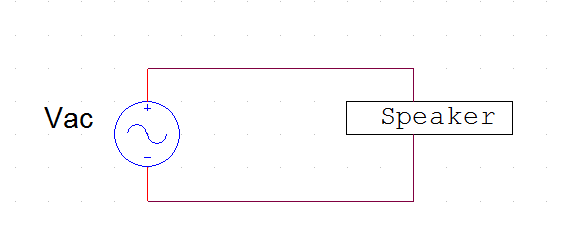
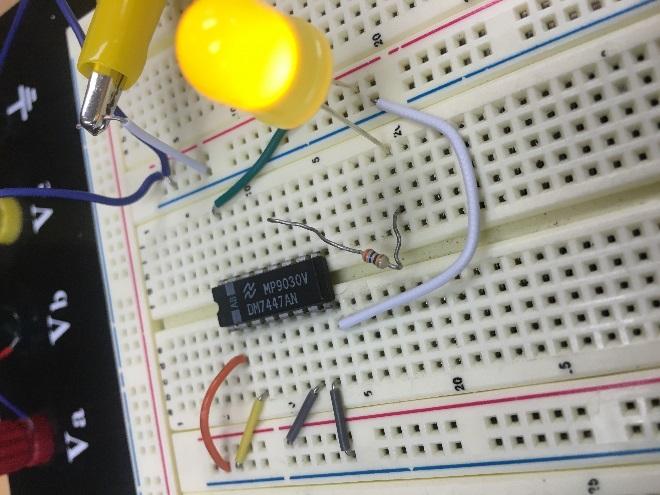
Figure 1: Test setup for the speaker.


Fill the following table. Discuss your results.
Table 1: Write your caption here…
Frequency
Observation
660 HzLow pitch sound at E note when using square wave
800 HzLow pitch sound 
1000 HzHigher than before but still a lower pitched sound
1300 HzPitch continues to increase with the 300 Hz added
1600 HzWith another 300 Hz added the pitch continued to get higher and louder


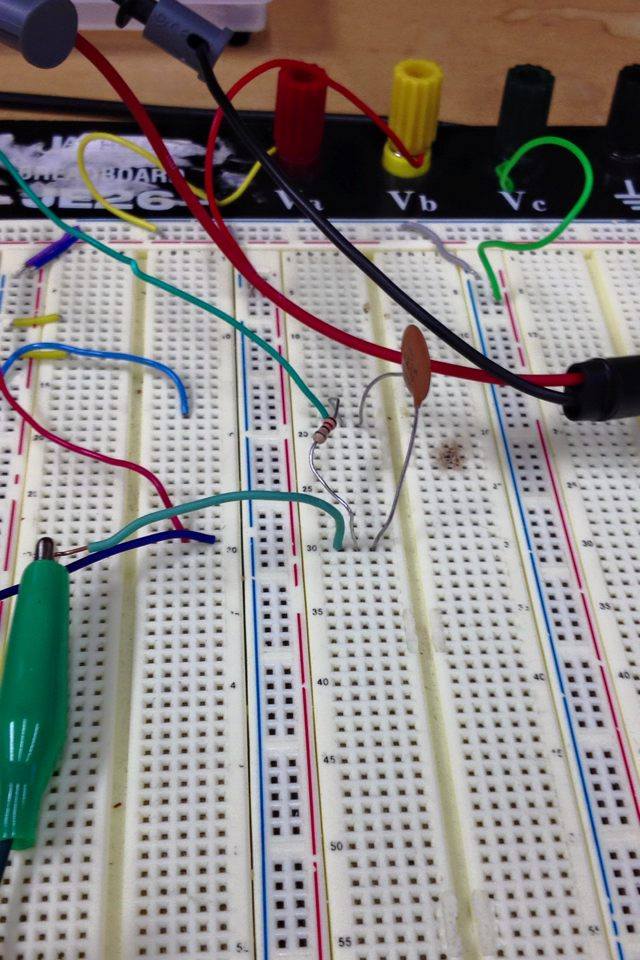
  1. Add one resistor to the circuit in series with the speaker (first 47 Ω, then 820 Ω). Measure the voltage across the speaker. Briefly explain your observations.
With the resistor added to the circuit in series with the speaker we were able to observe the circuit. With the frequency low the sound was more of a low pitch and as we increased our frequency the pitch began to rise and get louder.


Fill the following table. Discuss your results.
Table 1: Write your caption here…
Resistor value
Oscilloscope output
Observation
47 Ω
The output shows a sine wave with a frequency of 1.58kHzWe hooked both the input and the output up on the oscilloscope and the output has a smaller amplitude  
820 Ω
The output of the sine wave got much smaller with the higher resistor addedWith both of the inputs and outputs hooked up on the scope it is shown that with the higher resistor added it lowers the amplitude greatly 


  1. Build the following circuit. Add a resistor in series to the speaker to have an equivalent resistance of 100 Ω. Note that this circuit is a high pass filter. Set the amplitude of the input signal to 8 V. Change the frequency from low to high to observe the speaker sound. You should not hear anything at the beginning and start hearing the sound after a certain frequency. Use 22 nF for the capacitor.
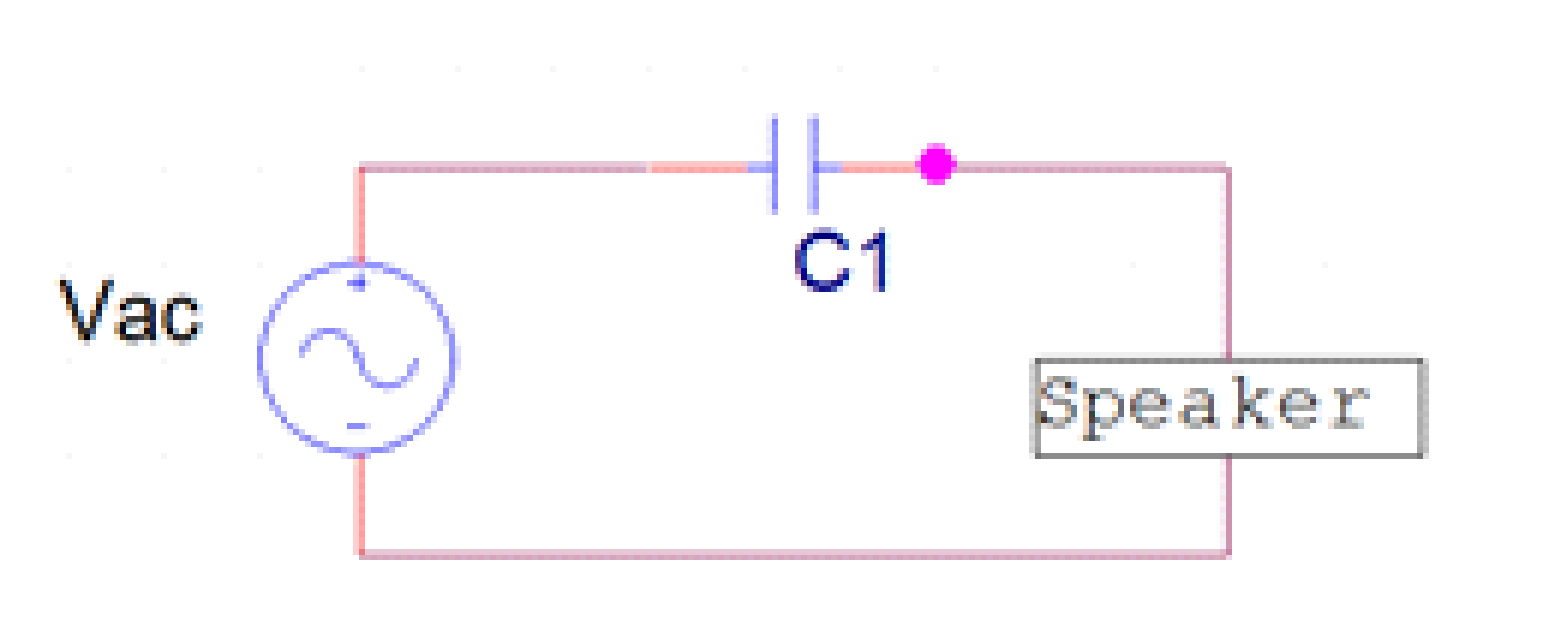
Figure 2: Test setup for the high pass filter.

Explain the operation.  (video)
High Pass Filter

High Pass Filter


  1. Frequency(Hz)      
    Vout(V)
              Vout/Vin
    500
    0.003
              0.00053
    1000
    0.005
              0.000884
    2000
    0.009
              0.001591
    3000
    0.012
              0.002122
    4000
    0.015
              0.002652
    5000
    0.016
              0.002829
    6000
    0.017
              0.003006
    7000
    0.019
              0.003359
    8000
    0.02
              0.003536
    9000
    0.017
              0.003006
    10000
    0.017
              0.003006
    11000
    0.017
              0.003006
    12000
    0.015
              0.002652
    13000
    0.015
              0.002652
    14000
    0.014
              0.002475
    16000
    0.011
              0.001945
    20000
    0.007
              0.001238


Graph 1


  1. What is the cut off frequency by looking at the plot in b

Looking at our graph from excel it is shown that the cutoff frequency of our filter is around 8000 Hz. 


  1. Draw Vout/Vin with respect to frequency using MATLAB. Your code would look like this;


Frequency = [ ]; % data points will be in the brackets
Output = [ ]; % Vout/Vin data points would be in the brackets.
plot(Frequency, Output, ’o-r’)
xlabel(‘  ’); %Right your x-axis label in ‘’
ylabel(‘  ’); %Right your y-axis label in ‘’


  1. Calculate the cut off frequency theoretically and compare with one that was found in c.

  1. Explain how the circuit works as a high pass filter.


  1. Design the circuit in 4 to act as a low pass filter and show its operation. Where would you put the speaker? Repeat 4a-g using the new designed circuit (e, f, and g are for blogI).
Low Pass Filter
Low Pass Filter

For creating the low pass filter the speaker will end up in parallel with the capacitor in order to have the low pass filter properties.

     Low Pass


Frequency
                   Vout                     
Vout/Vin
        1000
                   0.336
0.059406
        3000
                   0.259
0.045792
        5000
                   0.214
0.037836
        7000
                   0.172
0.03041
        10000
                   0.125
0.0221
        13000 
                   0.093
0.016443
        15000
                   0.077
0.013614
        17000
                   0.064
0.011315
        20000
                   0.048
0.008487
        23000
                   0.035
0.006188
        25000
                   0.028
0.00495
        27000
                   0.021
0.003713
        30000
                   0.013
0.002298
        33000
                   0.007
0.001238
        35000
                   0.005
0.000884


6.
1.     Construct the following circuit and test the speaker with headsets. Connect the amplifier output directly to the headphone jack (without the potentiometer). Load is the headphone jack in the schematic. “Speculate” the operation of the circuit with a video.

    With the circuit set up with an amplifier it was possible to put audio into the microphone and with our headphones hooked up we could somewhat hear the music. The music did not come through very clear but it was possible to hear the song. 


the amplifier output
directly to the headphone jack (without the potentiometer). Load is th
e headphone jack in the
schematic.
Speculate
the operation of the circuit with a video.Construct the following circuit and test the speaker with headsets. Connect
the amplifier output
directly to the headphone jack (without the potentiometer). Load is th
e headphone jack in the
schematic.
Speculate
the operation of the circuit with a video.


Construct the following circuit and test the speaker with headsets. Connect
the amplifier output
directly to the headphone jack (without the potentiometer). Load is th
e headphone jack in the
schematic.
Speculate
the operation of the circuit with a video.

Construct the following circuit and test the speaker with headsets. Connect
the amplifier output
directly to the headphone jack (without the potentiometer). Load is th
e headphone jack in the
schematic.
Speculate
the operation of the circuit with a video.

Thursday, March 10, 2016


    Week 8


     For our Rube Goldberg project we visioned using the circuit setup with a fan to push over the dominoes to create the effect to hit a ball. This ball would then roll down a tube to hit more dominoes to fall further and eventually end at a ball to knock over a set of blocks. After setting everything up we had to eliminate a few things as it was hard to recreate the exact setup we had planned. Our problems throughout the week started with getting the circuit to act how we wanted. Originally we wanted the digital part of the circuit with an OR gate to power the temperature sensor to power the op amp and the relay to start our motor. After spending a lot of time on the circuit, it was finally realized that we had the wrong op amp to make the relay work properly. This was realized the night before and had to rush to get the right op amp resistors correct to increase the temperature on the sensor that starts at around .7 volts to be amplified to the 5.5 volt range to switch the relay. The presentation didn't go as planned for the dominoes as our ball completely bounced over the dominoes. The circuit itself worked as planned until the dominoes didn't apply enough force on the resistor.


Friday, February 26, 2016

Week 7

Blogsheet week 7
Digital Circuits
  1. Force sensing resistor gives a resistance value with respect to the force that is applied on it. Try different loads (Pinching, squeezing with objects, etc.) and write down the resistance values. (EXPLAIN with TABLE)


  1. 7 Segment display:
    1. Check the manual of 7 segment display. Pdf document’s page 5 (or in the document page 4) circuit B is the one we have. Connect pin 3 or pin 14 to 5 V. Connect a 330 Ω resistor to pin 1. Other end of the resistor goes to ground. Which line lit up? Using package dimensions and function for B (page 4 in pdf), explain the operation of the 7 segment display by lighting up different segments. (EXPLAIN with VIDEO).

Depending on what pin you put the resistor is is what will light up on the 7 segment display.

7 Segment Display Light Up


    1. Using resistors for each segment, make the display show 0 and 5. (EXPLAIN with PHOTOs)
Segment Display of Zero

Segment Display of Five


  1. Display driver (7447). This integrated circuit (IC) is designed to drive 7 segment display through resistors. Check the data sheet. A, B, C, and D are binary inputs. Pins 9 through 15 are outputs that go to the display. Pin 8 is ground and pin 16 is 5 V.
    1. By connecting inputs either 0 V or 5 V, check the output voltages of the driver. Explain how the inputs and outputs are related. Provide two different input combinations. (EXPLAIN with PHOTOs and TRUTH TABLE)
Truth Table

Binary Input of 0010


Binary Input of 0111


UPDATE! You cannot actually measure the output voltages directly (I challenge you to figure out why!). You need to connect an LED and a resistor. LED’s positive terminal will go to 5 V. Negative terminal will be connected to your outputs via a resistor. The circuit would look like below:
C:\Users\kaya2t\Dropbox\TEACHING\EGR 393\week 7\Photo Feb 23, 11 45 24 AM.jpg


    1. Connect the display driver to the 7 segment display. 330 Ω resistors need to be used between the display driver outputs and the display (a total of 7 resistors). Verify your question 3a outputs with those input combinations. (EXPLAIN with VIDEO)


7 Segment Display Connected to 7447


Input Combinations from 3a.


  1. 555 Timer:
    1. Construct the circuit in Fig. 14 of the 555 timer data sheet. VCC = 5V. No RL (no connection to pin 3). RA = 150 kΩ, RB = 300 kΩ, and C = 1 µF (smaller sized capacitor). 0.01 µF capacitor is somewhat larger in size. Observe your output voltage at pin 3 by oscilloscope. (Breadboard and Oscilloscope PHOTOs)
Oscilloscope Waveform

Circuit Layout with 555 Timer


    1. Does your frequency and duty cycle match with the theoretical value? Explain your work.

The measured and calculated were fairly similar. The frequency was off more than the duty cycle. The calculated values can be seen above by using the equations written down. 


    1. Connect the force sensing resistor in series with RA. How can you make the circuit give an output? Can the frequency of the output be modified with the force sensing resistor? (Explain with VIDEO)
With the force sensing resistor added in series it is possible to get an output and also modify the frequency based on the amount of force added to the sensor.


Force Sensor


  1. Binary coded decimal (BCD) counter (74192). This circuit generates a 4-bit counter. With every clock change, output increases; 0000, 0001, 0010, …, 0111, 1000, 1001. But after 1001 (which is decimal 9), it goes back to 0000. That way, in decimal, it counts from 0 to 9. Outputs of 74192 are labelled as QA (Least significant bit), QB, QC, and QD (Most significant bit) in the data sheet (decimal counter, 74192). Use the following connections:
5 V: pins 4, 11, 16.
0 V (ground): pins 8, 14.
10 µF capacitor between 5 V and ground.

    1. Connect your 555 timer output to pin 5 of 74192. Observe the input and each output on the oscilloscope. (EXPLAIN with VIDEO and TRUTH TABLE)
555 Timer Inputs and Outputs


  1. 7486 (XOR gate). Pin diagram of the circuit is given in the logic gates pin diagram pdf file. Ground pin is 7. Pin 14 will be connected to 5 V. There are 4 XOR gates. Pins are numbered. Connect a 330 Ω resistor at the output of one of the XOR gates.
    1. Put an LED in series to the resistor. Negative end of the LED (shorter wire) should be connected to the ground. By choosing different input combinations (DC 0V and DC 5 V), prove XOR operation through LED. (EXPLAIN with VIDEO)

Based on the table from the 7447 part of the lab it is possible to pre determine when the light will be on based on the truth table.
XOR Implementation with 0V and 5V


    1. Connect XOR’s inputs to the BCD counters C and D outputs. Explain your observation. (EXPLAIN with VIDEO)

XOR Connected to BCD

    1. For 6b, draw the following signals together: 555 timer (clock), A, B, C, and D outputs of 74192, and the XOR output. (EXPLAIN with VIDEO)


  1. Connect the entire circuit: Force sensing resistor triggers the 555 timer. 555 timer’s output is used as clock for the counter. Counter is then connected to the driver (Counter’s A, B, C, D to driver’s A, B, C, D). Driver is connected to the display through resistors. XOR gate is connected to the counter’s C and D inputs as well and an LED with a resistor is connected to the XOR output. Draw the circuit schematic. (VIDEO and PHOTO)
The circuit is extremely messy and hard to see but this one was rushed. I had everything done and recorded but my phone broke and I lost all my videos and pictures.
Full Circuit 

Full Circuit Schematic(Messy)


  1. Using other logic gates provided (AND and OR), come up with a different LED lighting scheme. (EXPLAIN with VIDEO)
For the AND gates and with the truth table it is possible to either use C and D or A and B to determine when the light will turn on. For input A and B the light will turn on with an AND gate at 3 and 7. For inputs C and D the light wont turn on as the input never has 1 for C and 1 for D at the same time.
For the OR gate the lights will be off only at 0, 4 and 8 as they have values of 0 for both A and B.


                            AND Gate Inputs AB

OR Gates input AB